d'Alembert
Park Wood SSSI
Here is an assortment of images of the Park Wood SSSI (Site of Special Scientific Interest) in West London, showing elevations and gradients of the terrain, together with example analyses of predicted water flow through parts of the site.
We have been working with the management of the SSSI, creating 3D printed maps and detailed images showing gradients and water flows.
The brightness in an image indicates either elevation (in the relief maps) or gradient (in the gradient maps). The lowest value appears as black, the highest value appears as white.
The source data is availble from DEFRA (Department for Environment, Food & Rural Affairs). The specific files are (TQ09se_DTM_1m, TQ19sw_DTM_1m, TQ08ne_DTM_1m, TQ18nw_DTM_1m), which are part of the DTM Composite dataset.
Click on an image to enlarge it.
Elevations
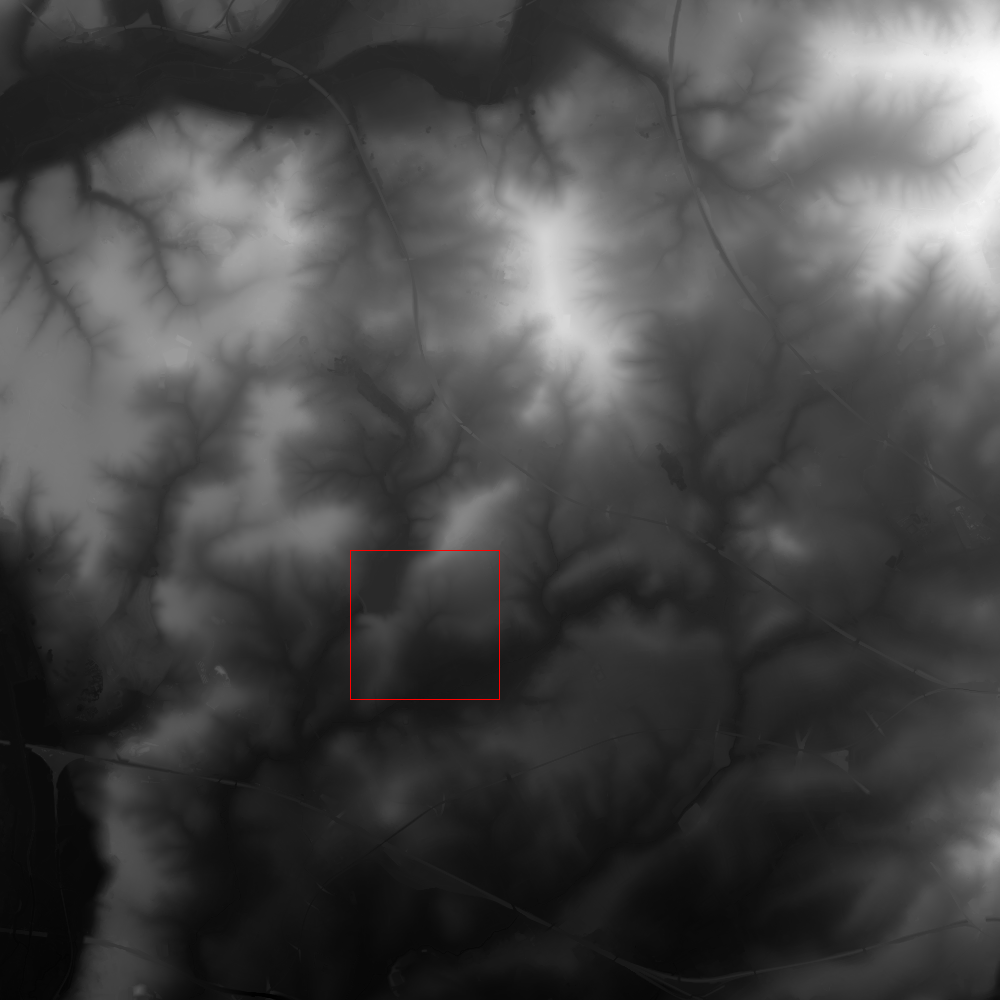
An overview of the area showing a 10km x 10k region arround the SSSI, at 10m resolution. The red box encloses the region shown in subsequent images. To the top left of the boxed region you can just make out Ruislip Lido, which is to the north west of the SSSI. This appears as a uniform grey area. The distinct white region NNE of the boxed area is Pinner Hill.
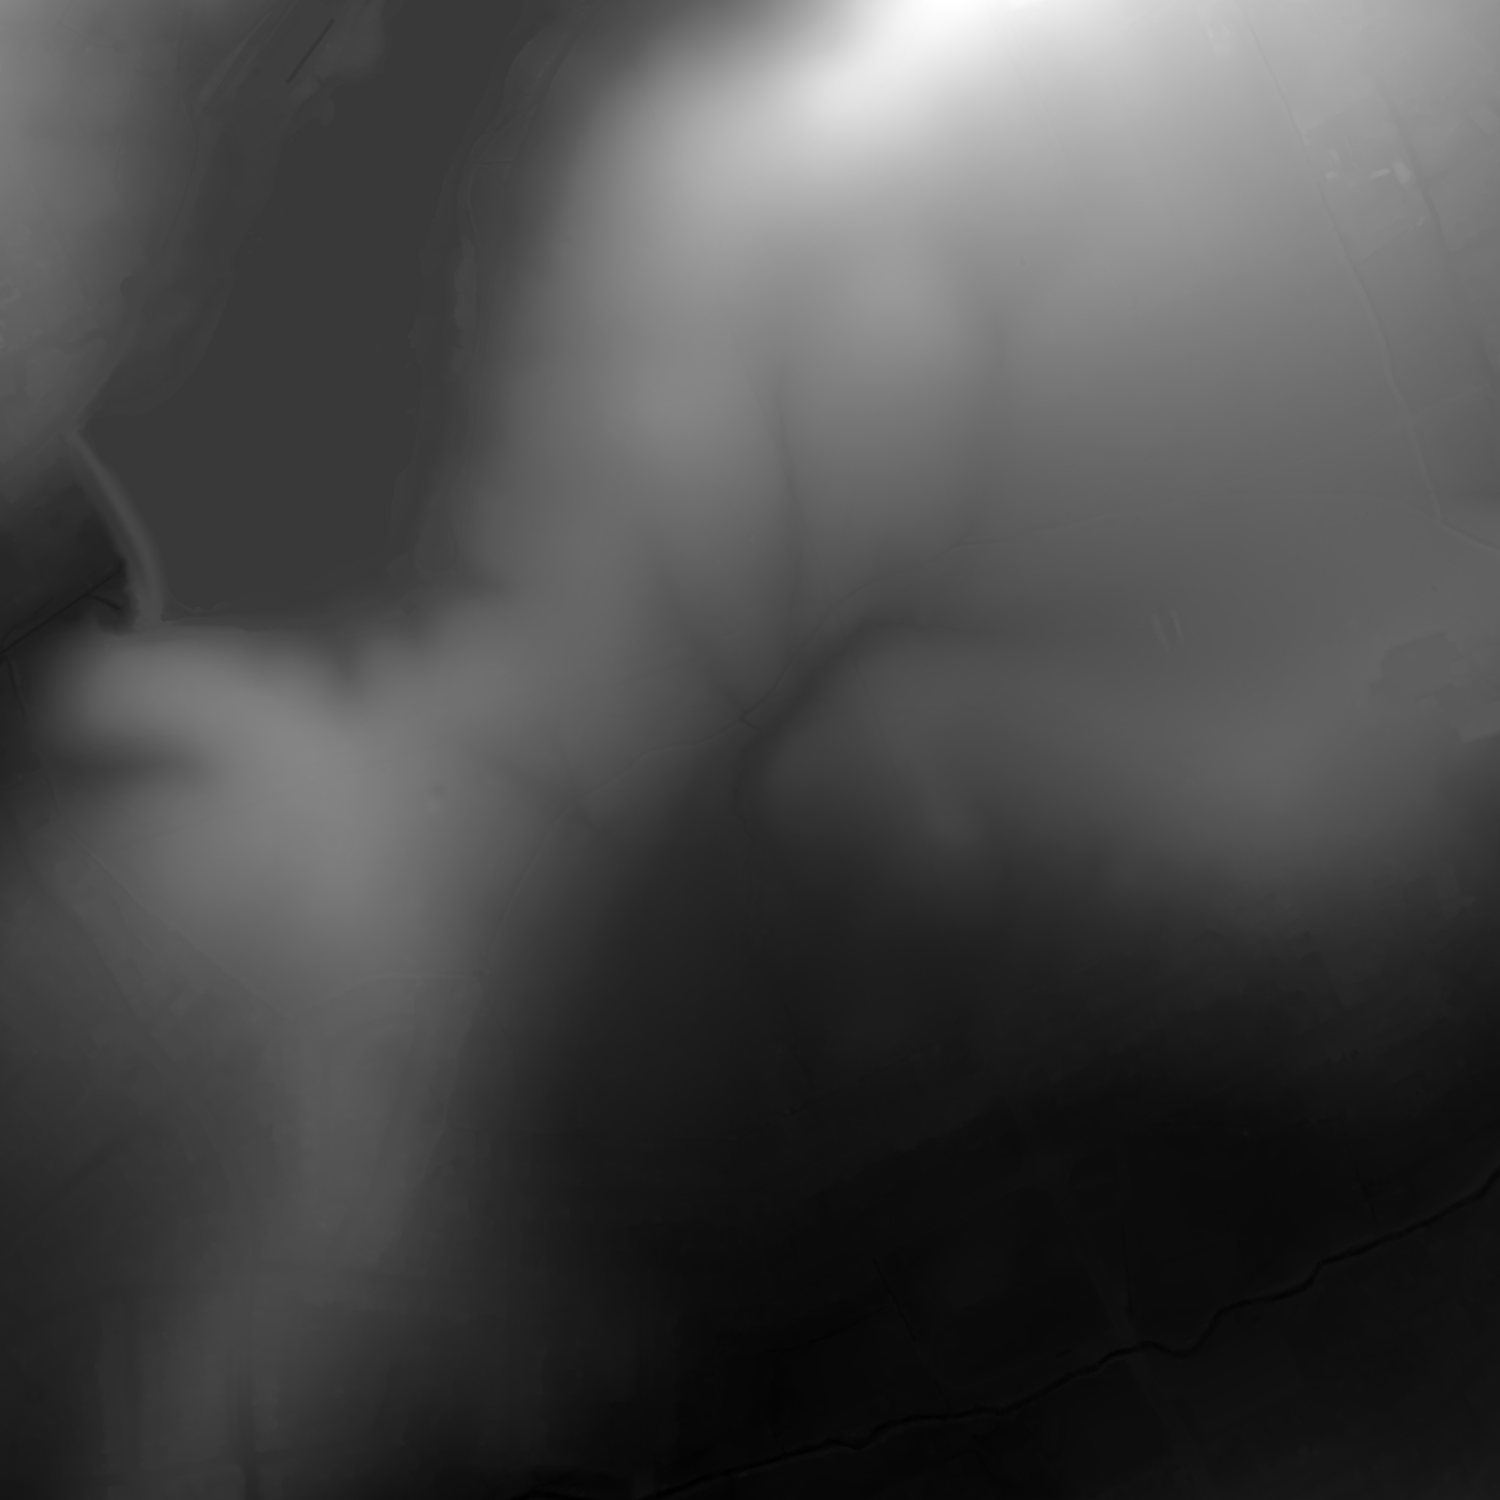
This image zooms in on a 1.5km x 1.5km region at 1m resolution - it corresponds to the boxed region in the previous image. This smaller region is used in the following images showing gradients and modelled water flows. The greyscale range in this image differs from the previous image because the minimum and maximum elevations differ between the two images. This has the effect of bringing out more detail as we zoom in.
Ruislip Lido can be seen in the top left corner as a uniform grey area, with the dam visible as a slightly curved thin brightish line running approximately north-south. The SSSI itself is to the south east of the lido.
Gradients
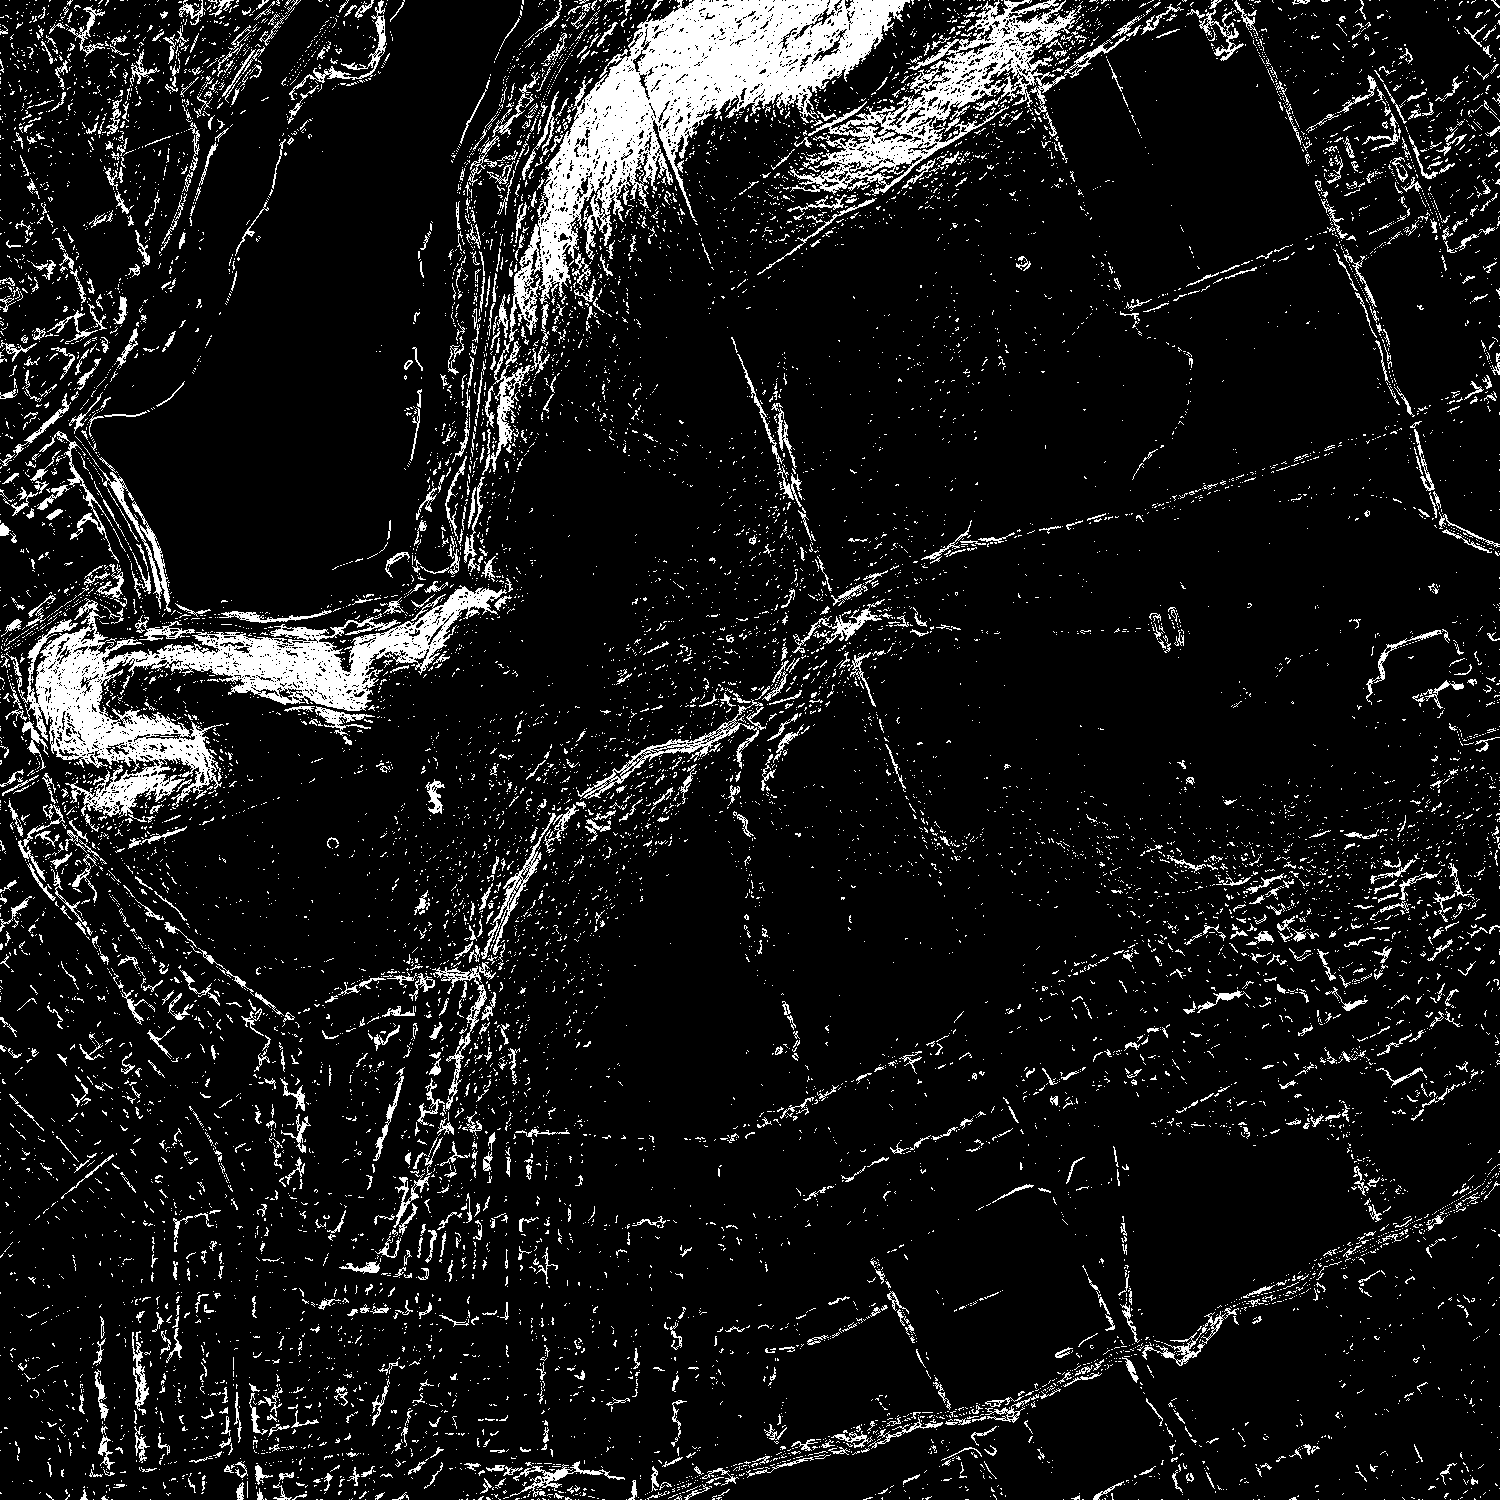
The following set of images show the gradients across the terrain, at a resolution of 1m. The gradients are calculated using 2D second order central differences. It can also be interesting to calculate the laplacian, but the capped gradients do a good job.
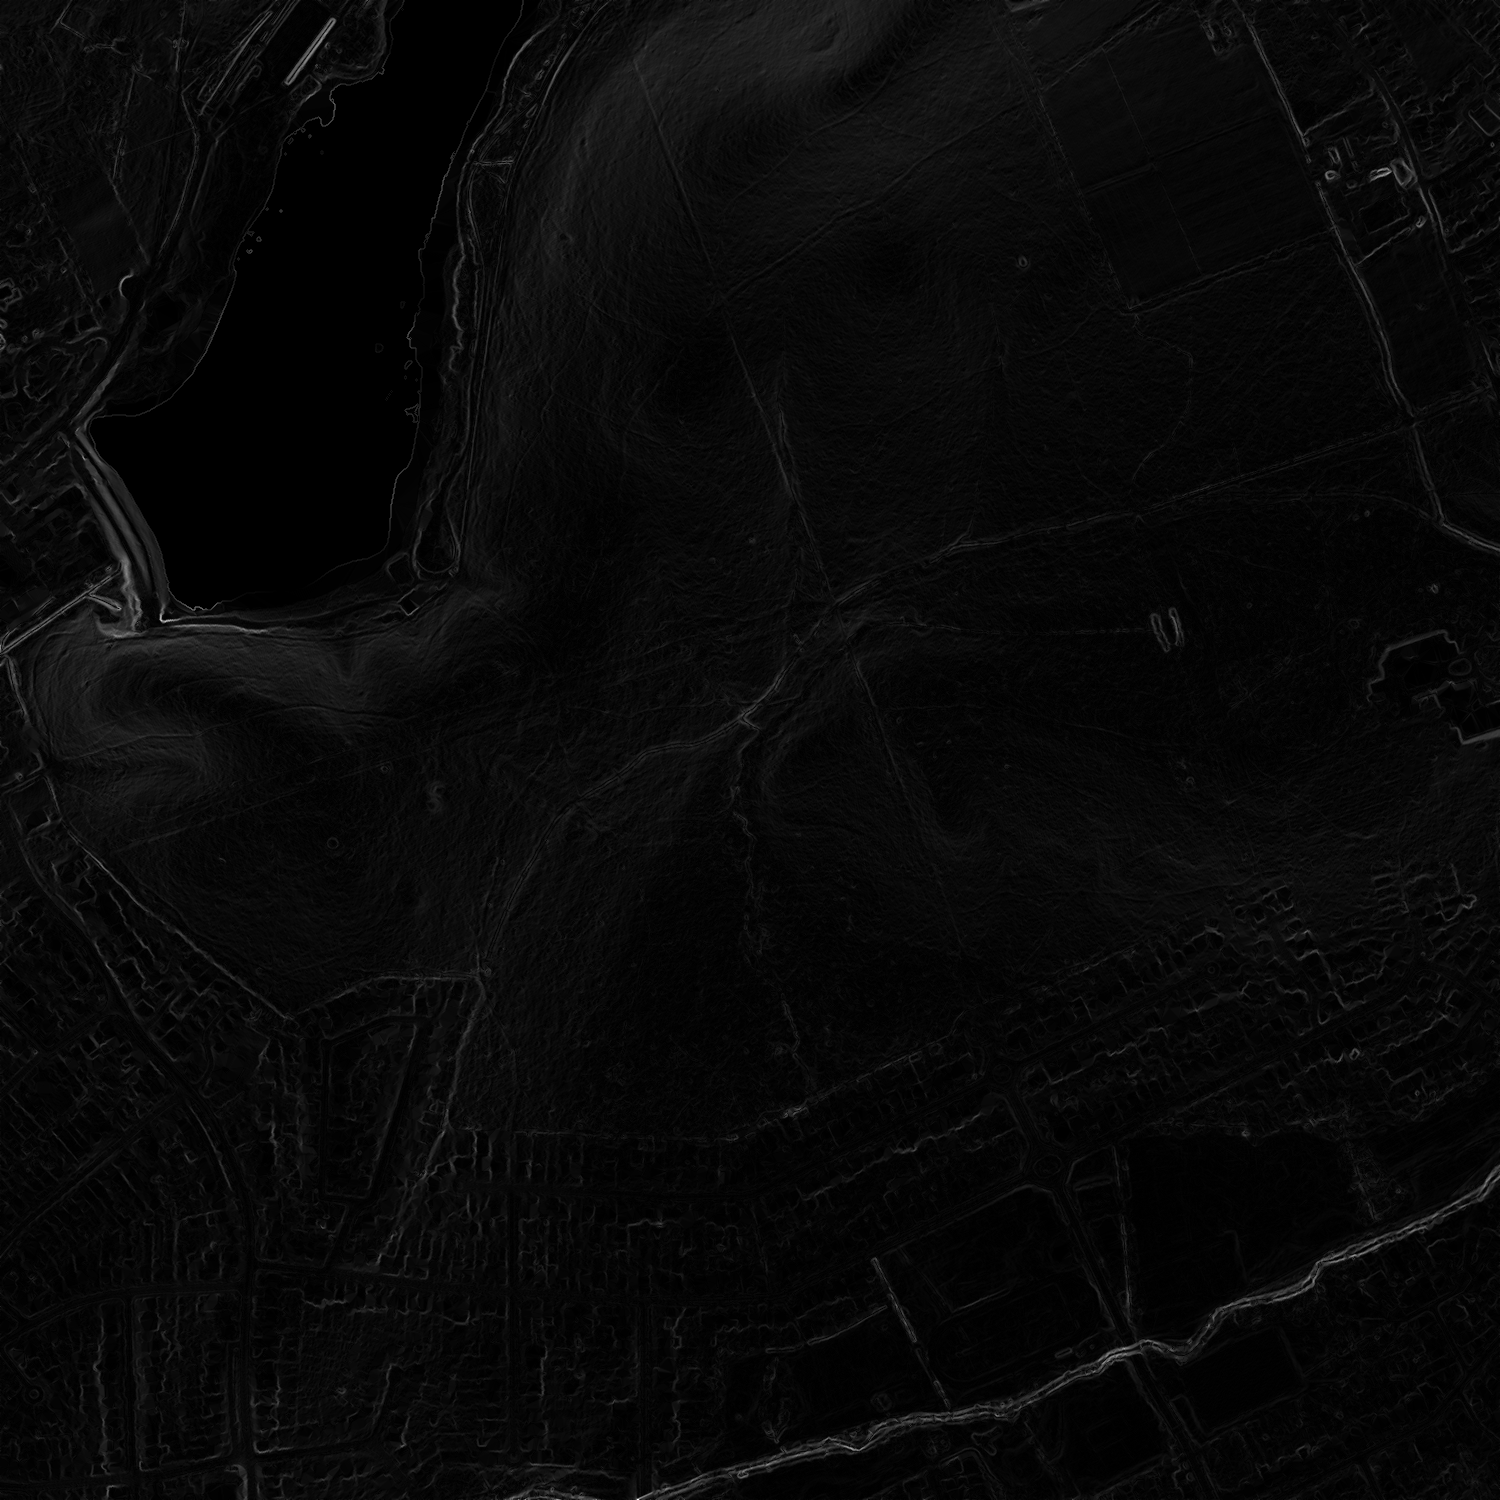
This first image shows the raw gradient calculations. We see very little detail because the largest gradient is around 150%, but most gradients are much lower. These sporadic large gradients appears as pure white, while most of the area appears as dark grey or black, seeing as it is mostly less steep. The horizontal resolution is 1m, so all it takes in a single steep hump or river bank to swamp the image.
In the following images, the gradient is capped, thus bringing out the less steep areas. For example, in the 50% image, all gradients above 50% are set to exactly 50% and thus appear as pure white.
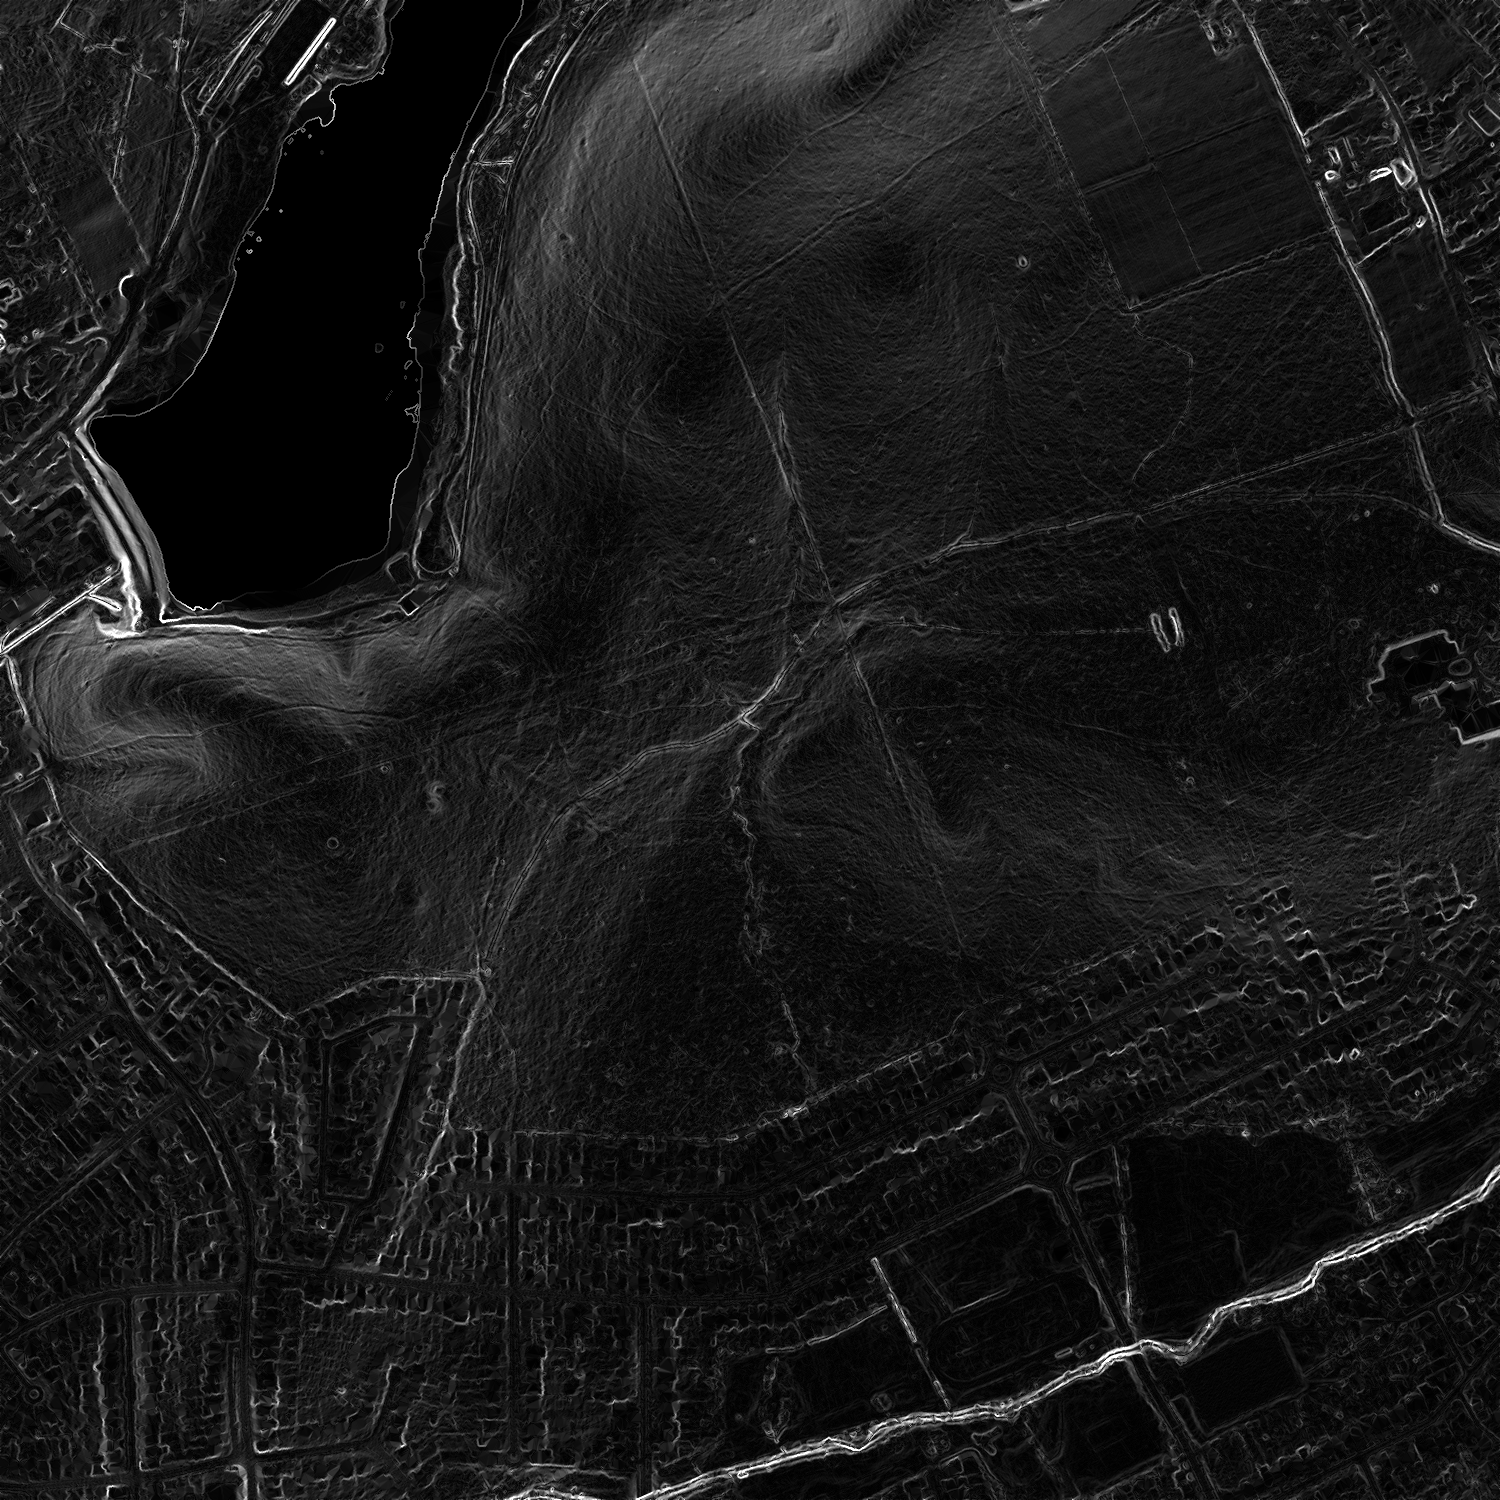
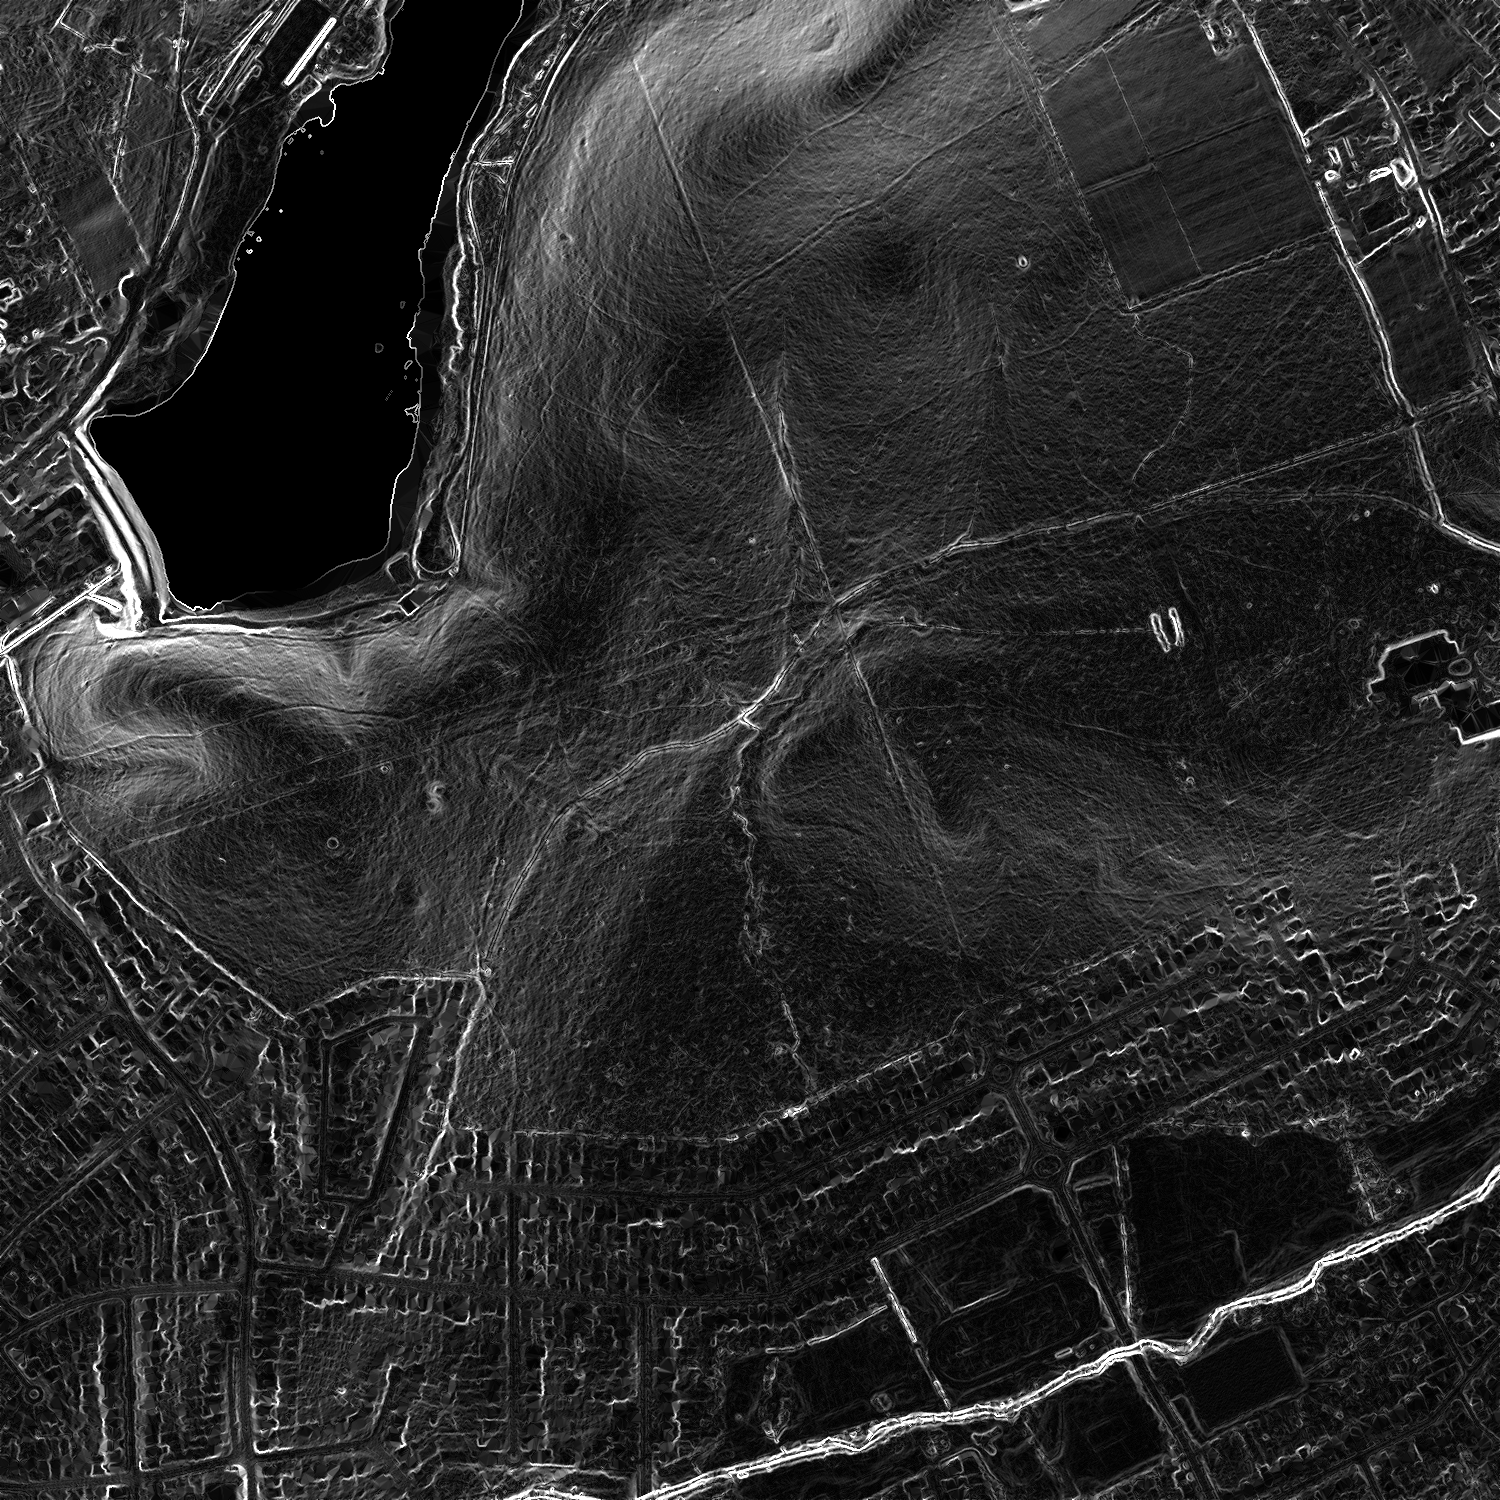
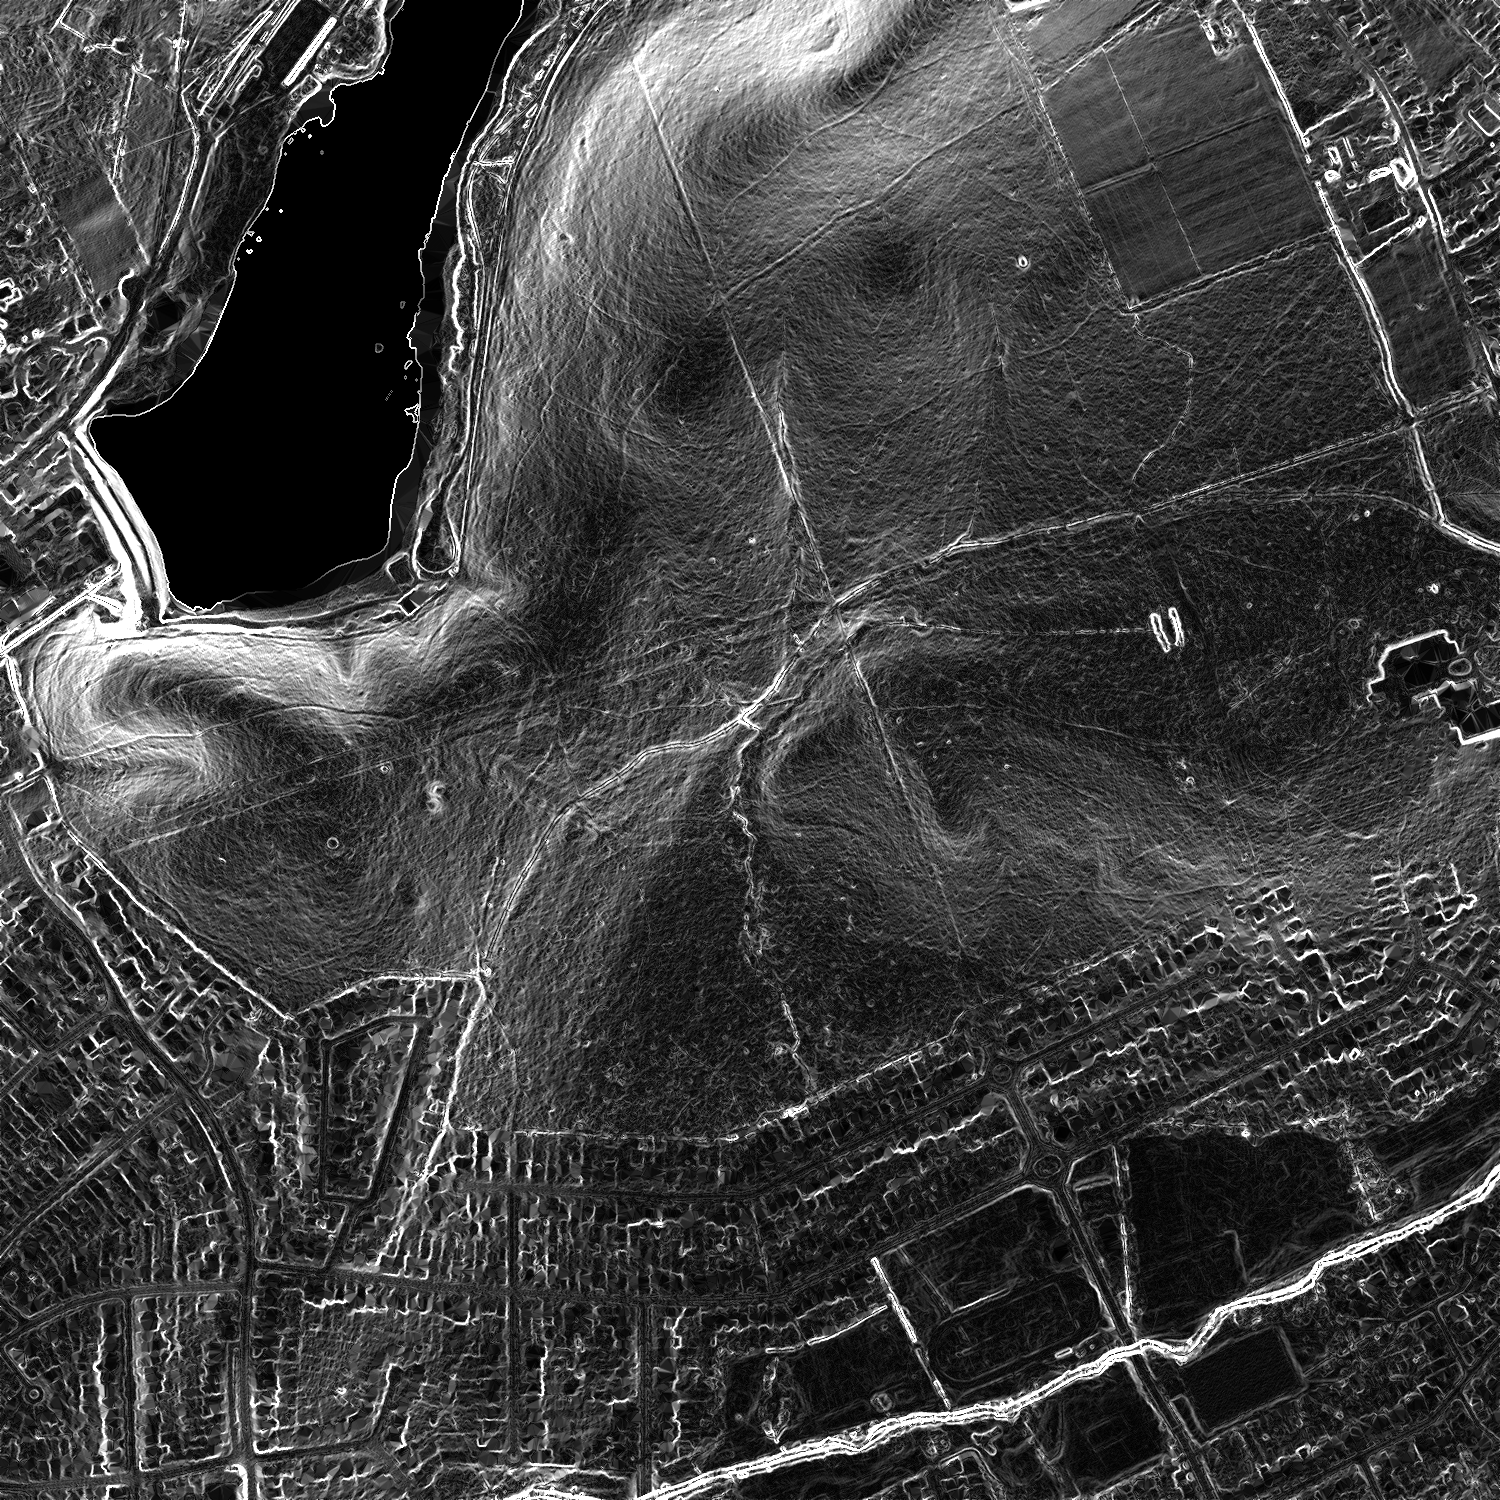
As the gradient is increasingly capped, we can see the River Pinn appearing more clearly as the bright line at the lower right of the image.
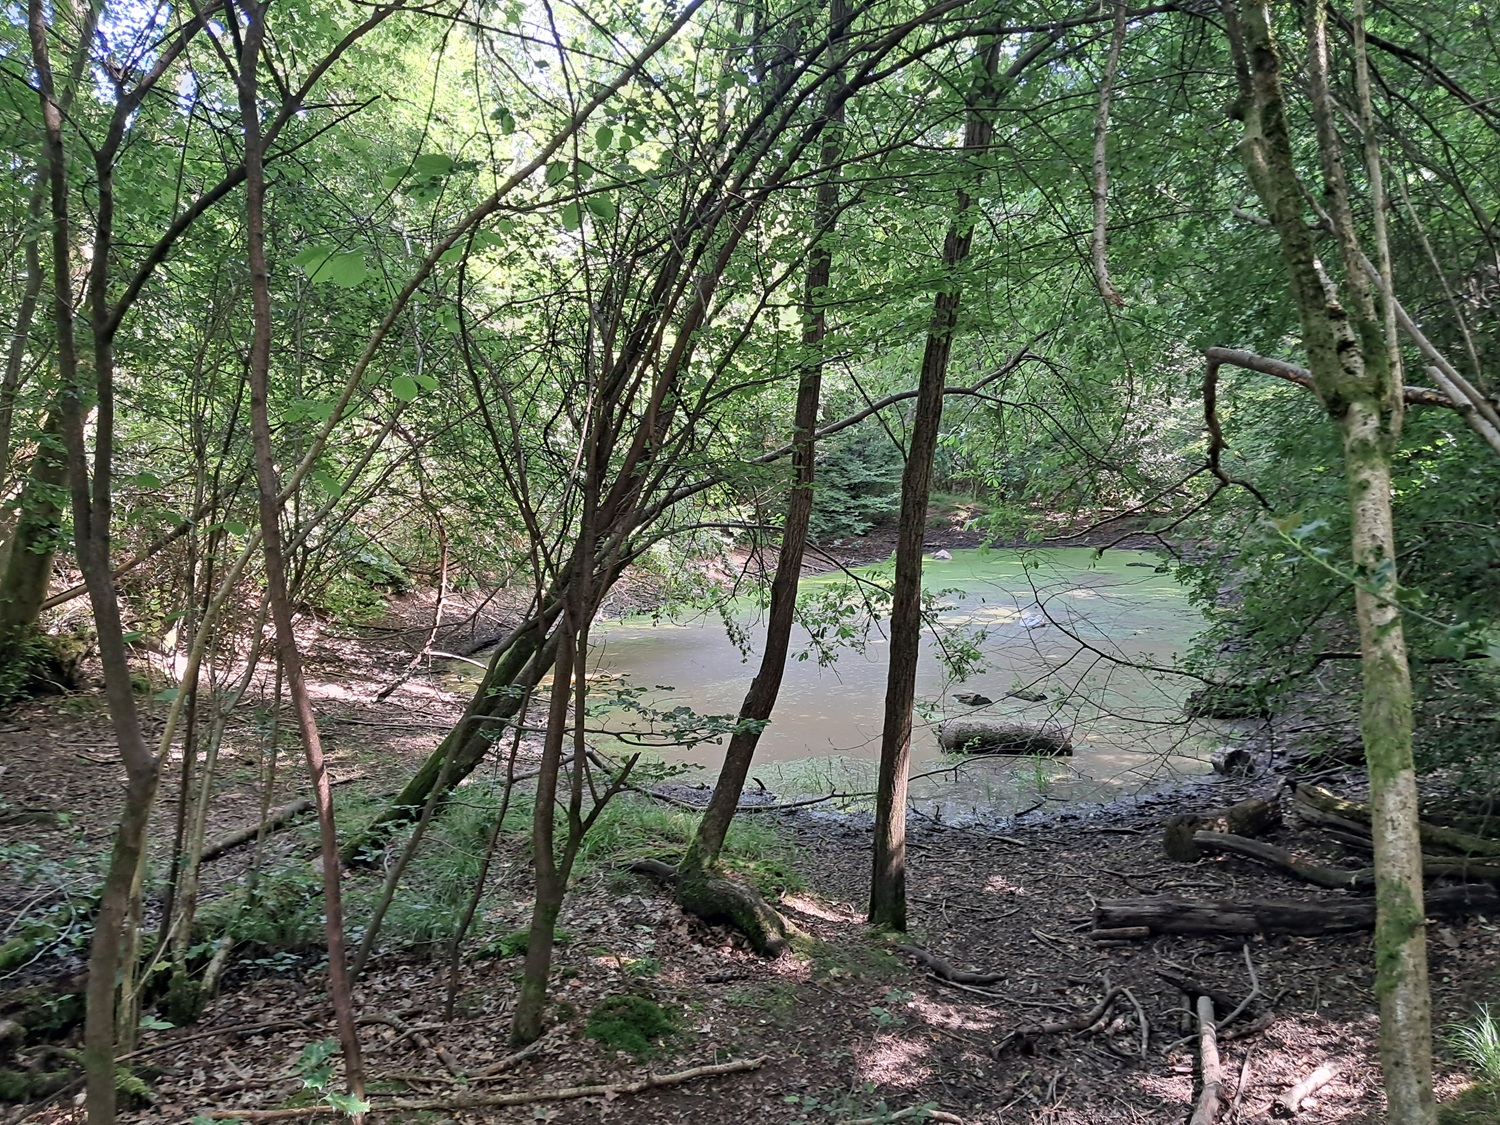
We also see a small distinct feature appearing mid-way up the image towards the right. It appears as two parallel lines running roughly north-south. This feature is not at all clear in the elevation images or the uncapped gradients. Searching in the parkland itself we find what it is - a small pond surrounded by low, but steep, banks.
Gradient Ranges
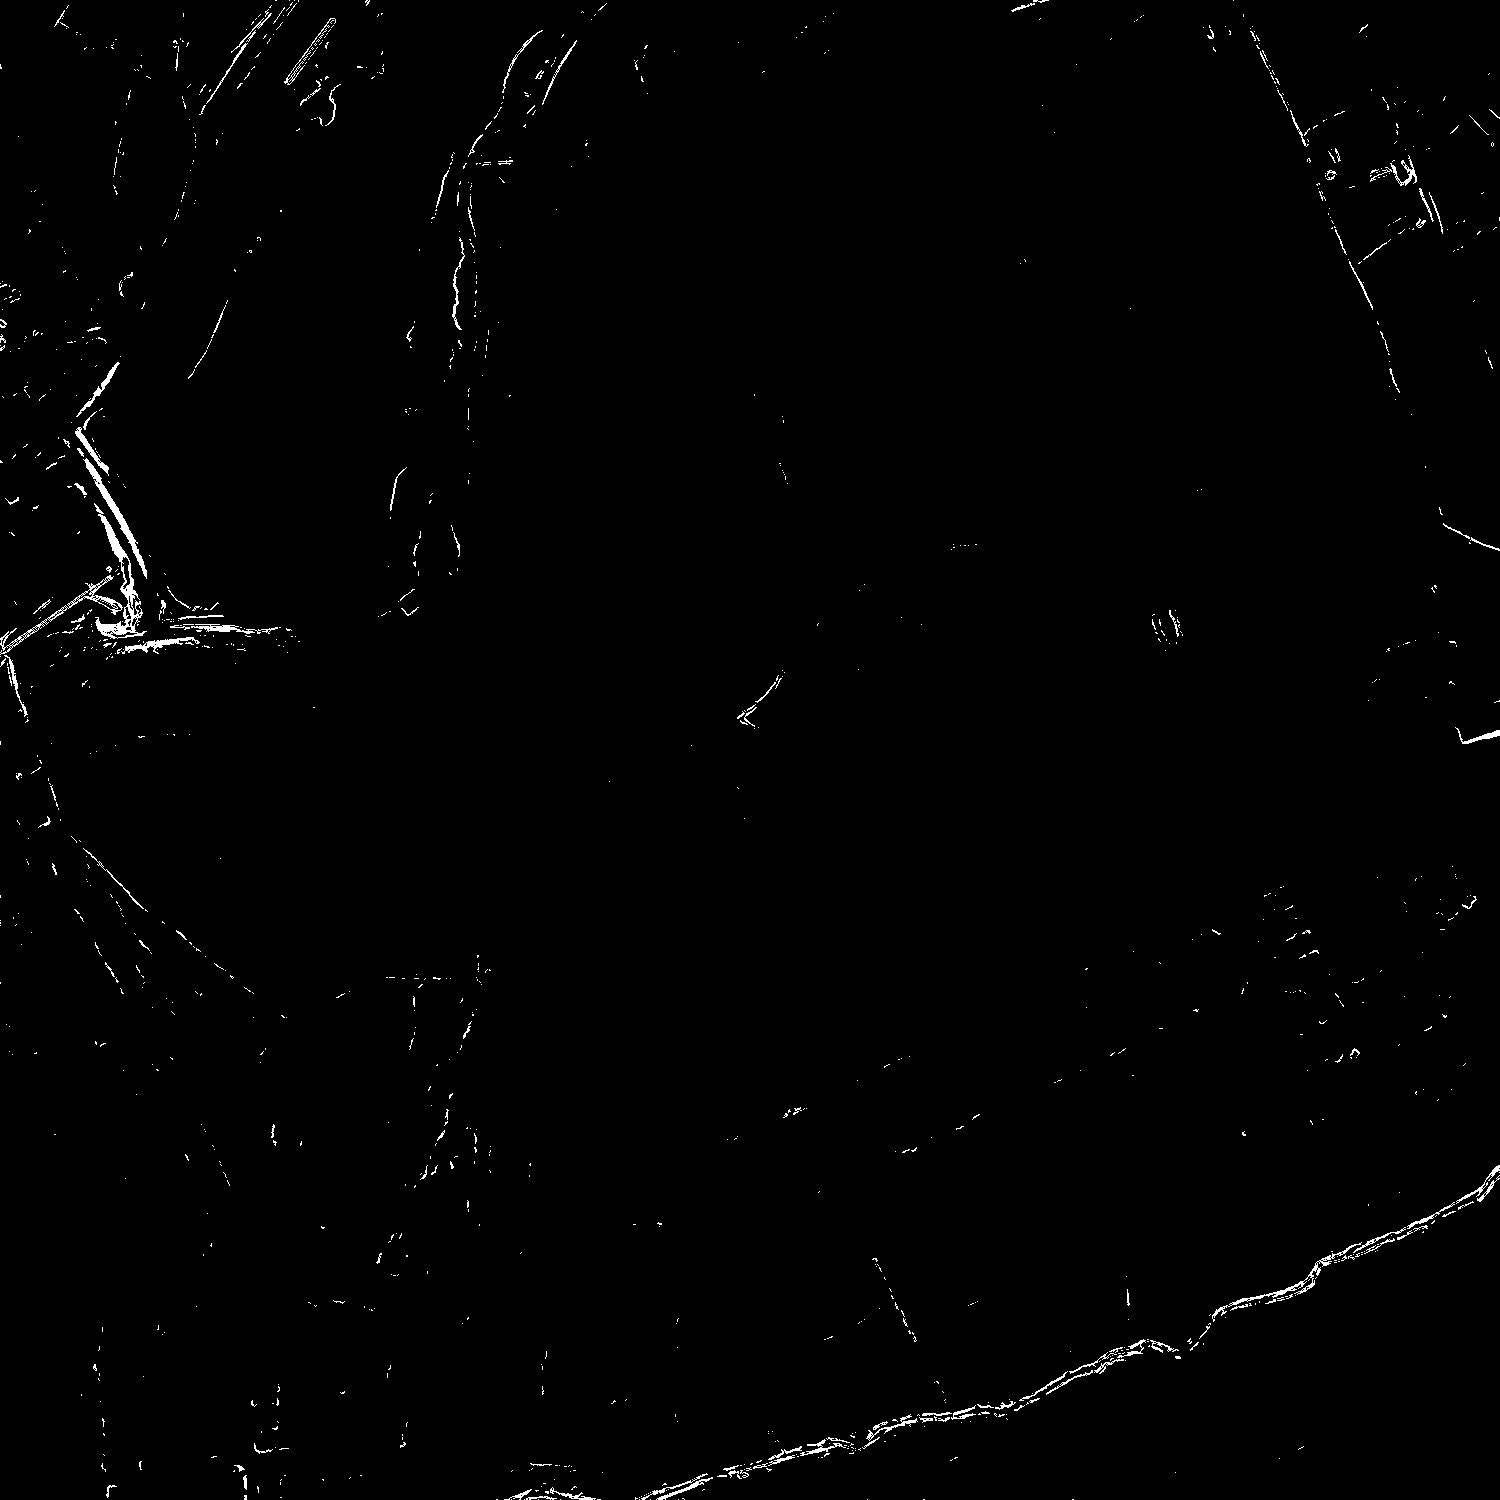
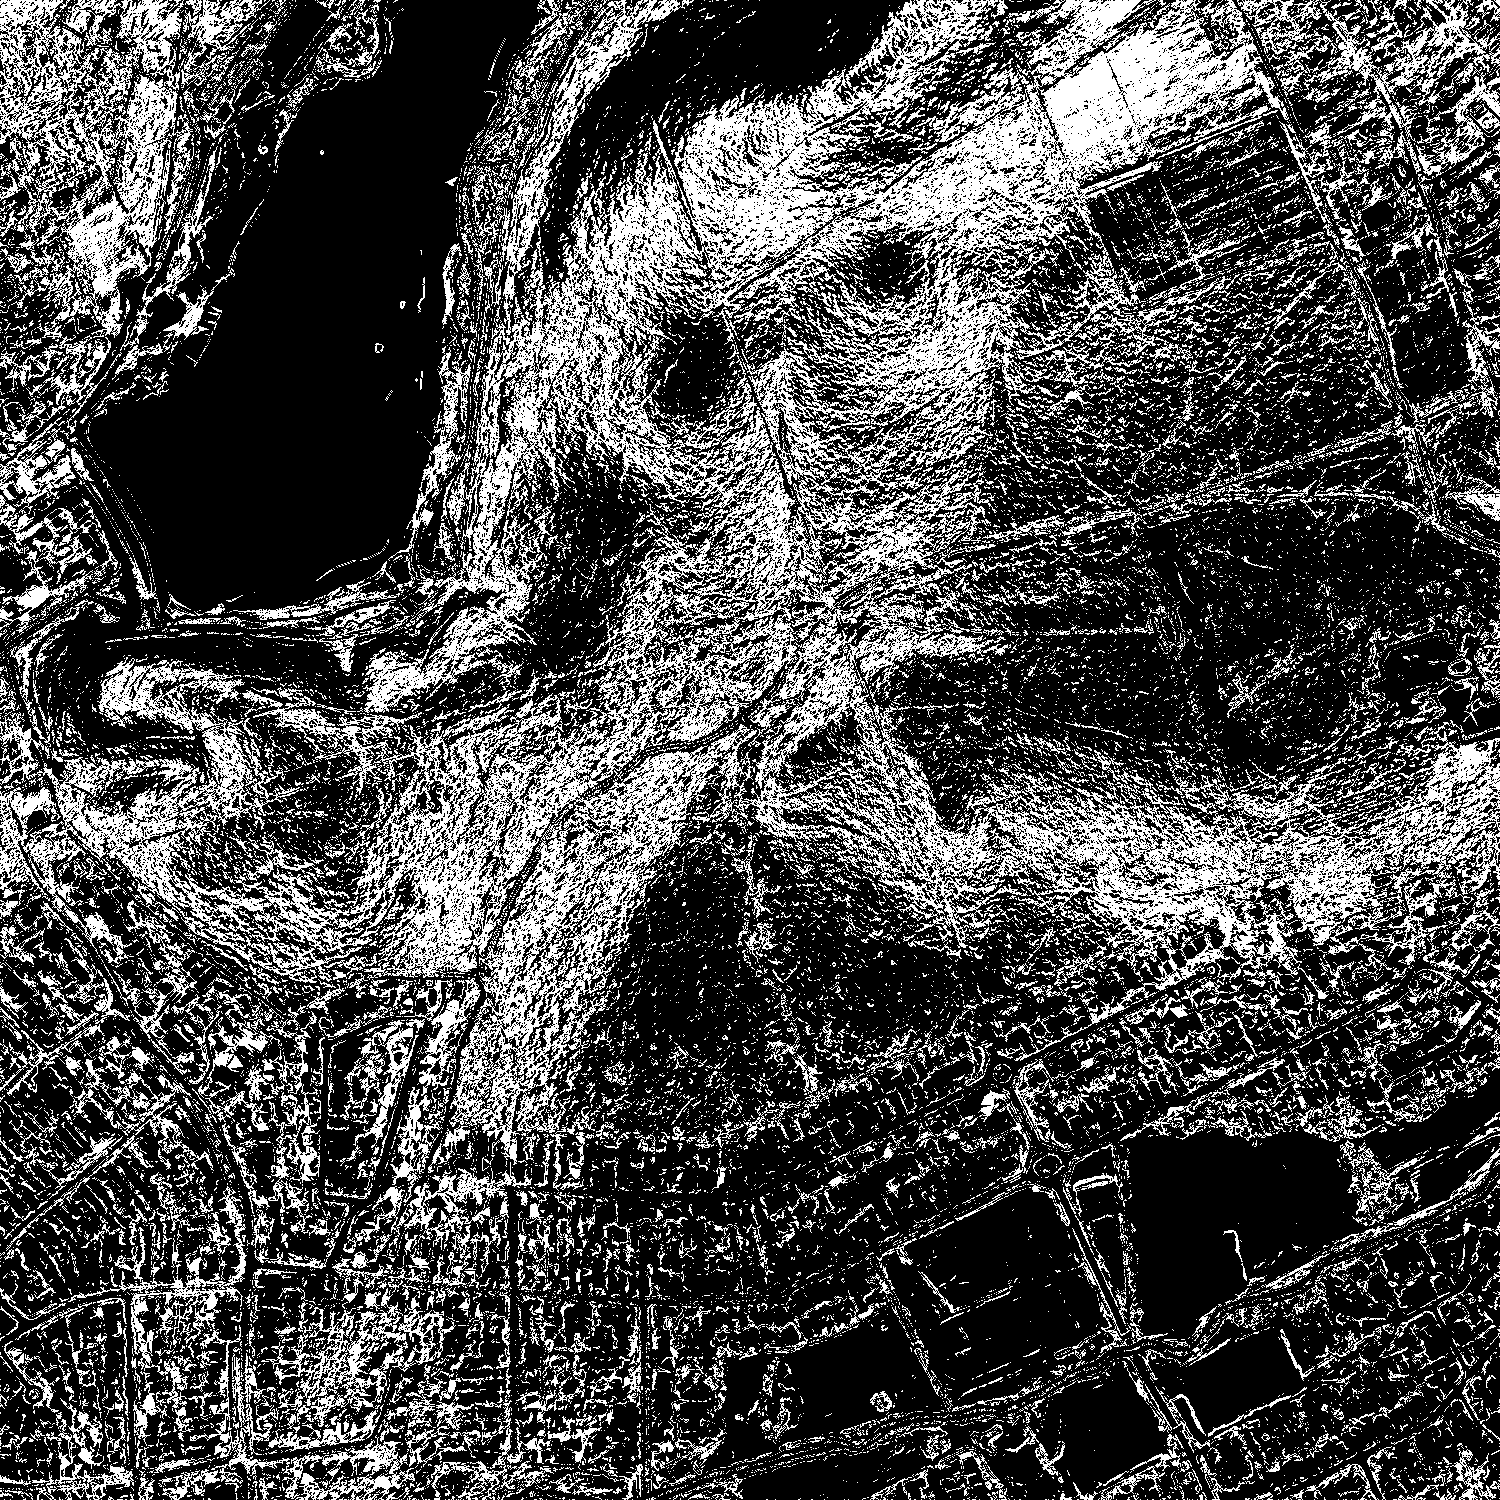
This is a variation on the capped gradients. Instead of capping the gradients, these only show gradients within a certain range. Areas with gradients above or below the range are set to zero, and thus appear black.


Flow
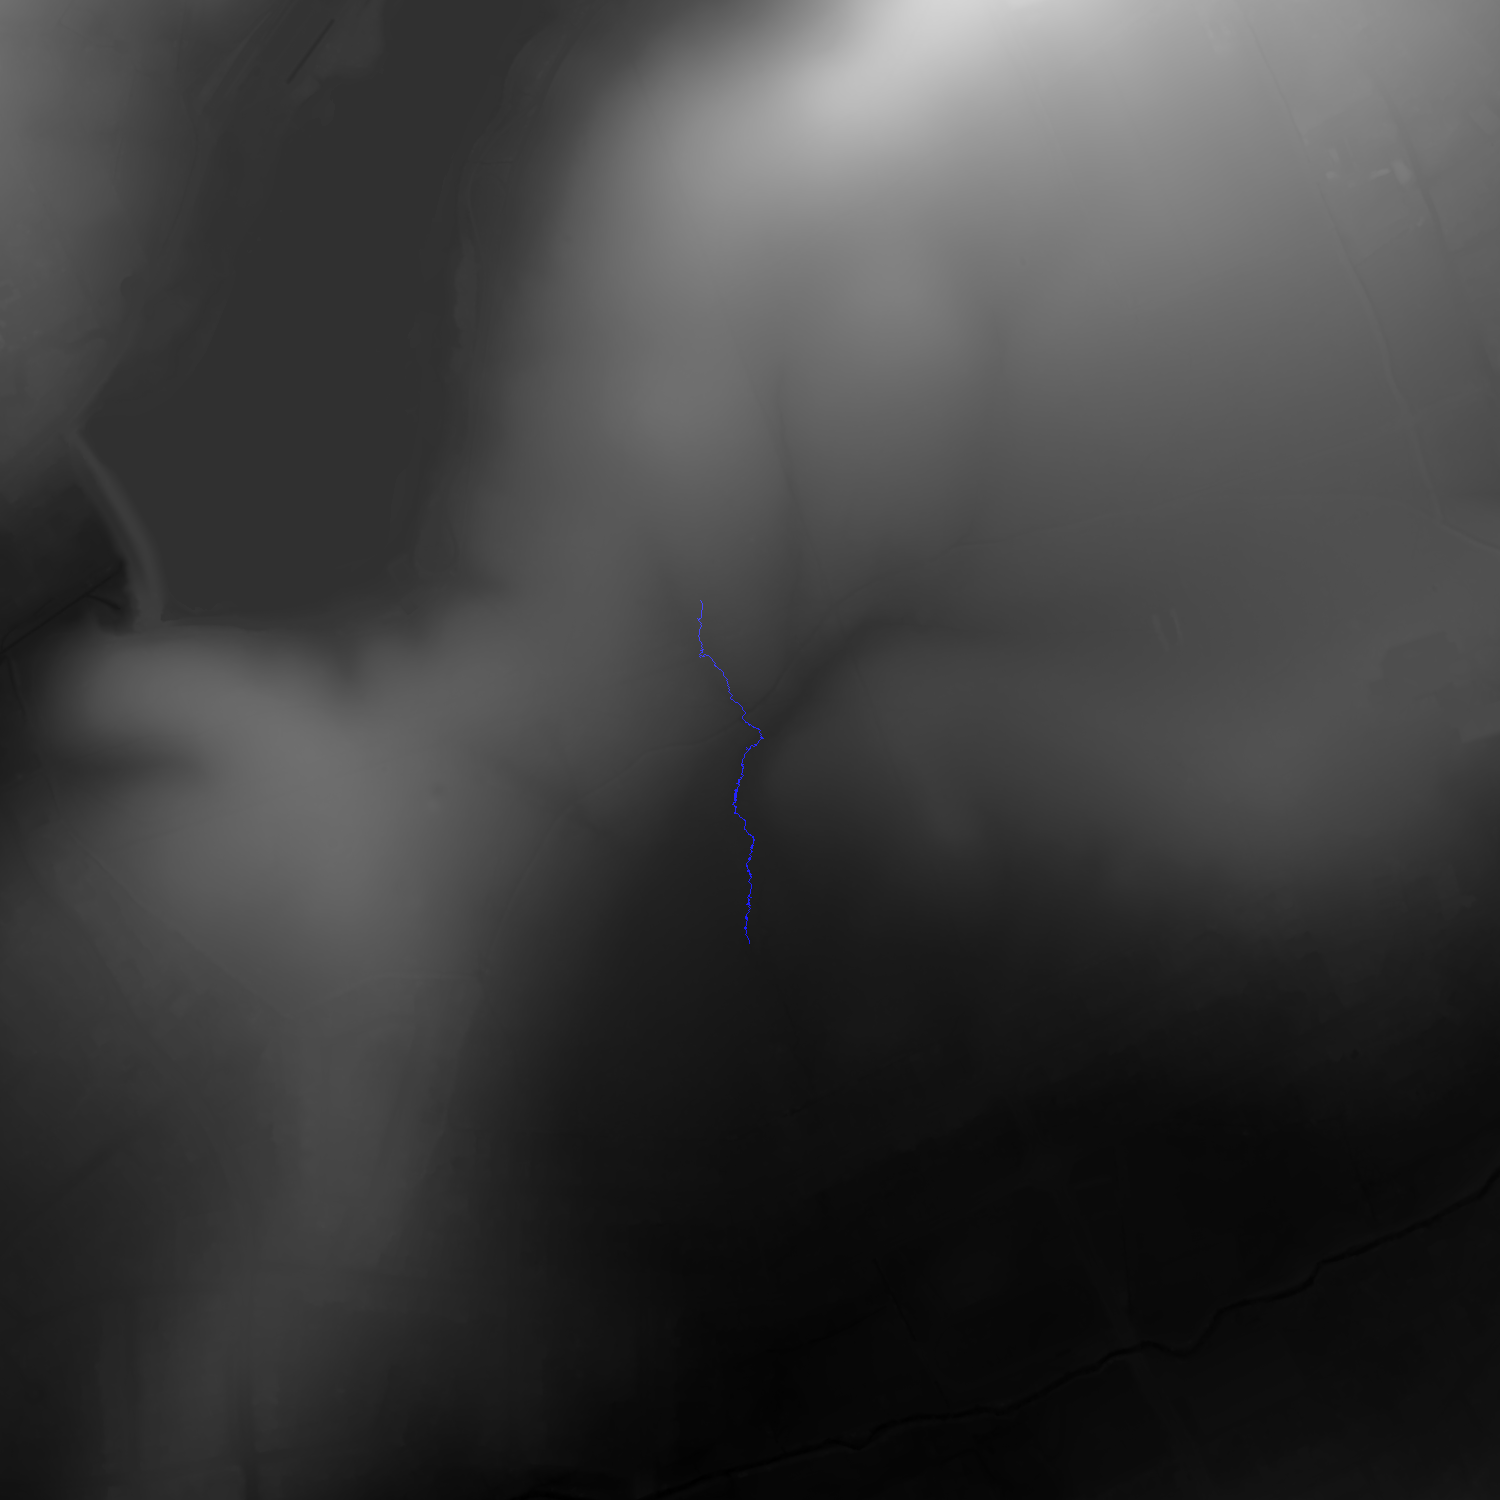
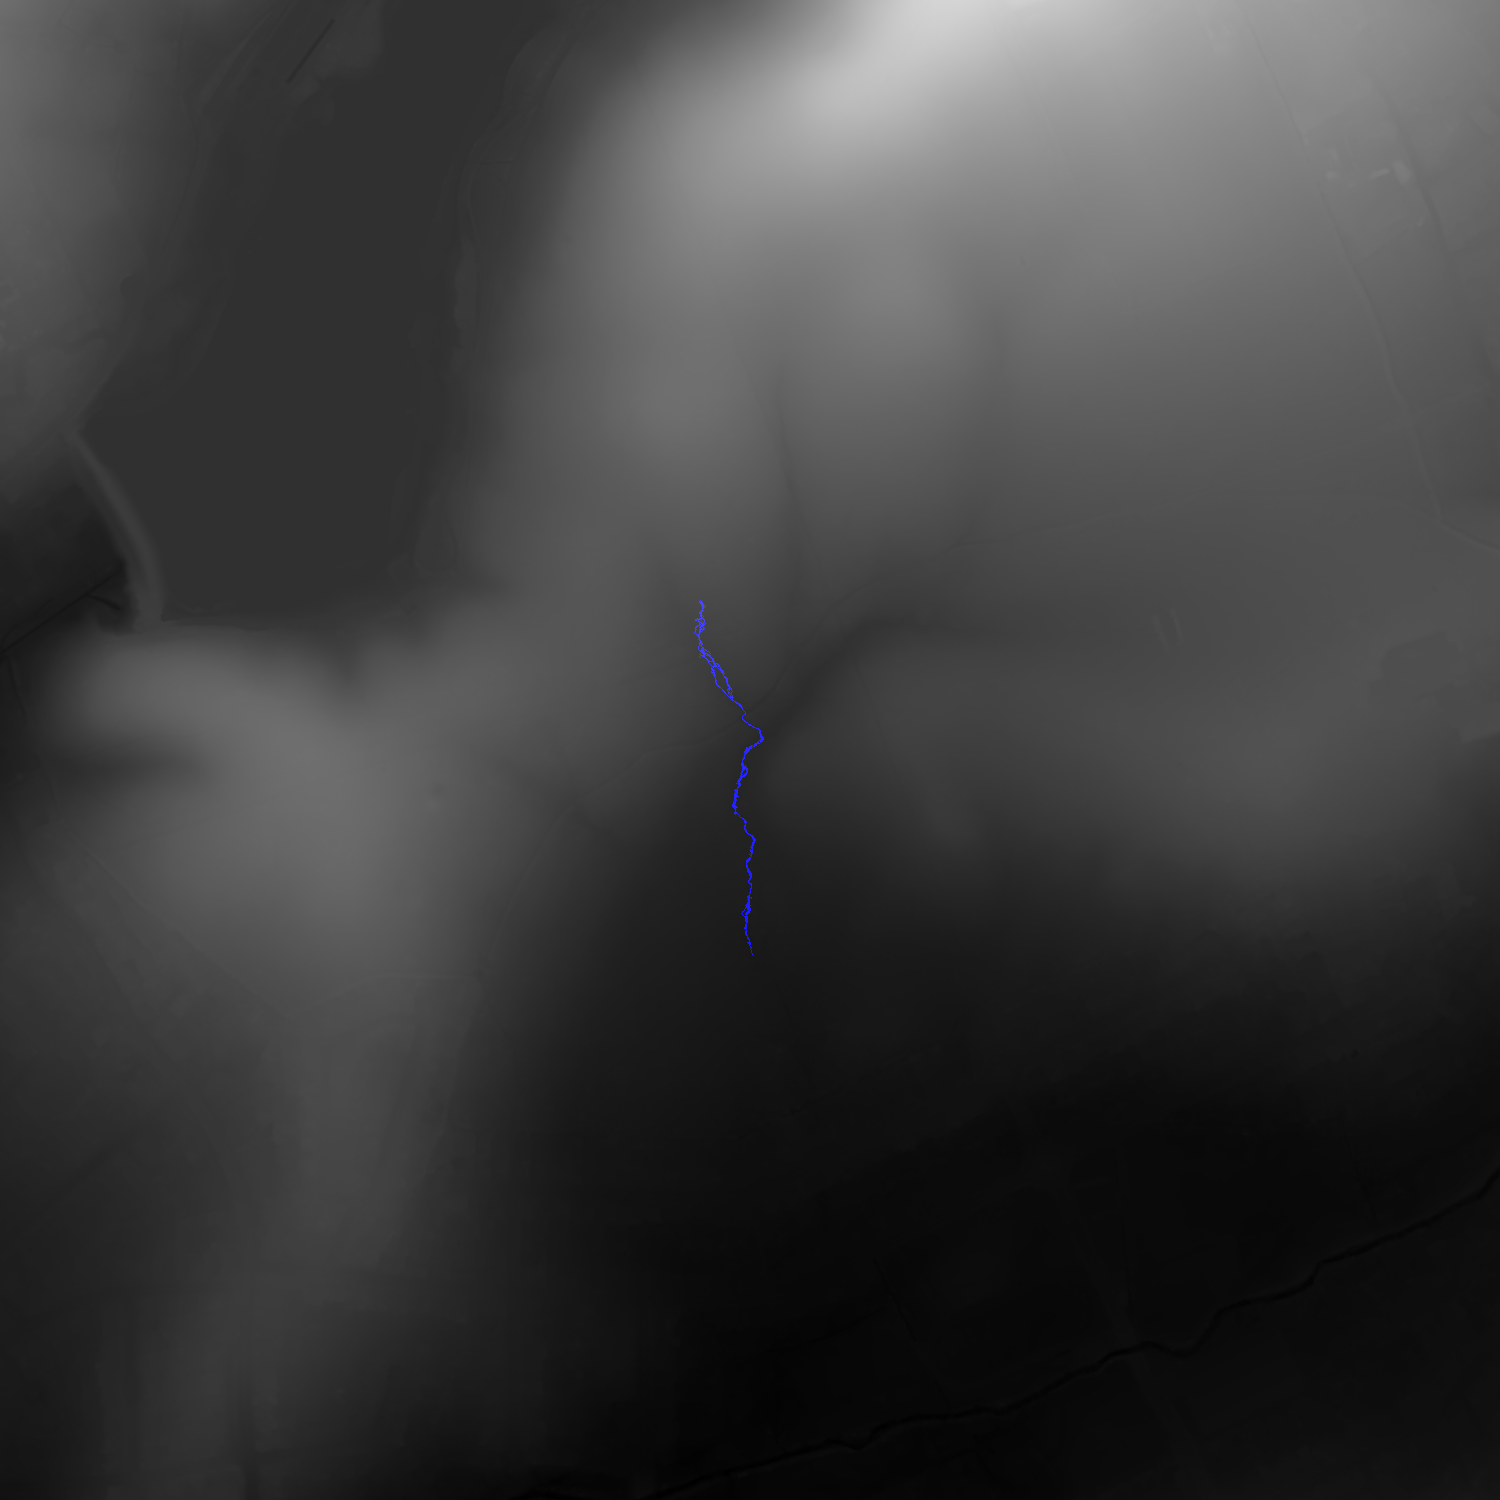
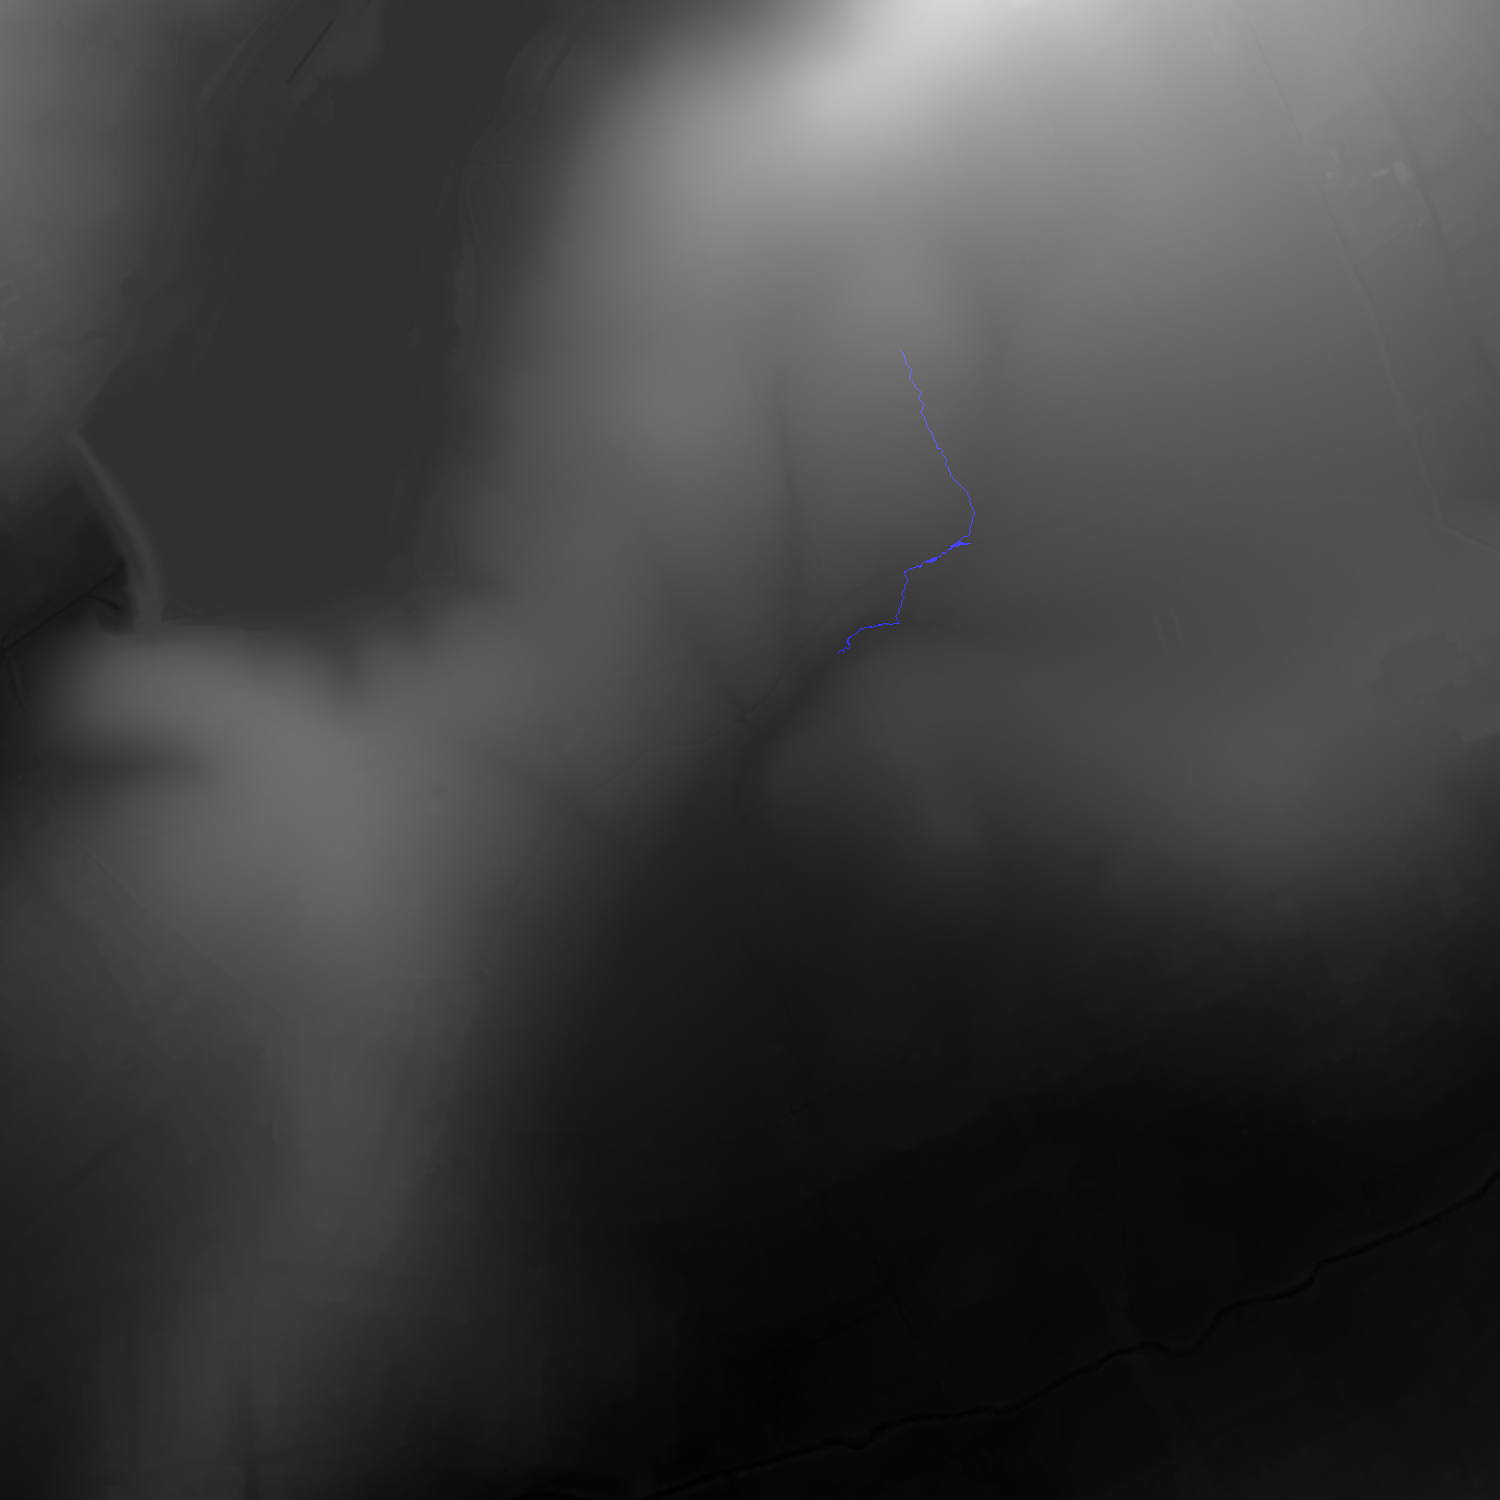
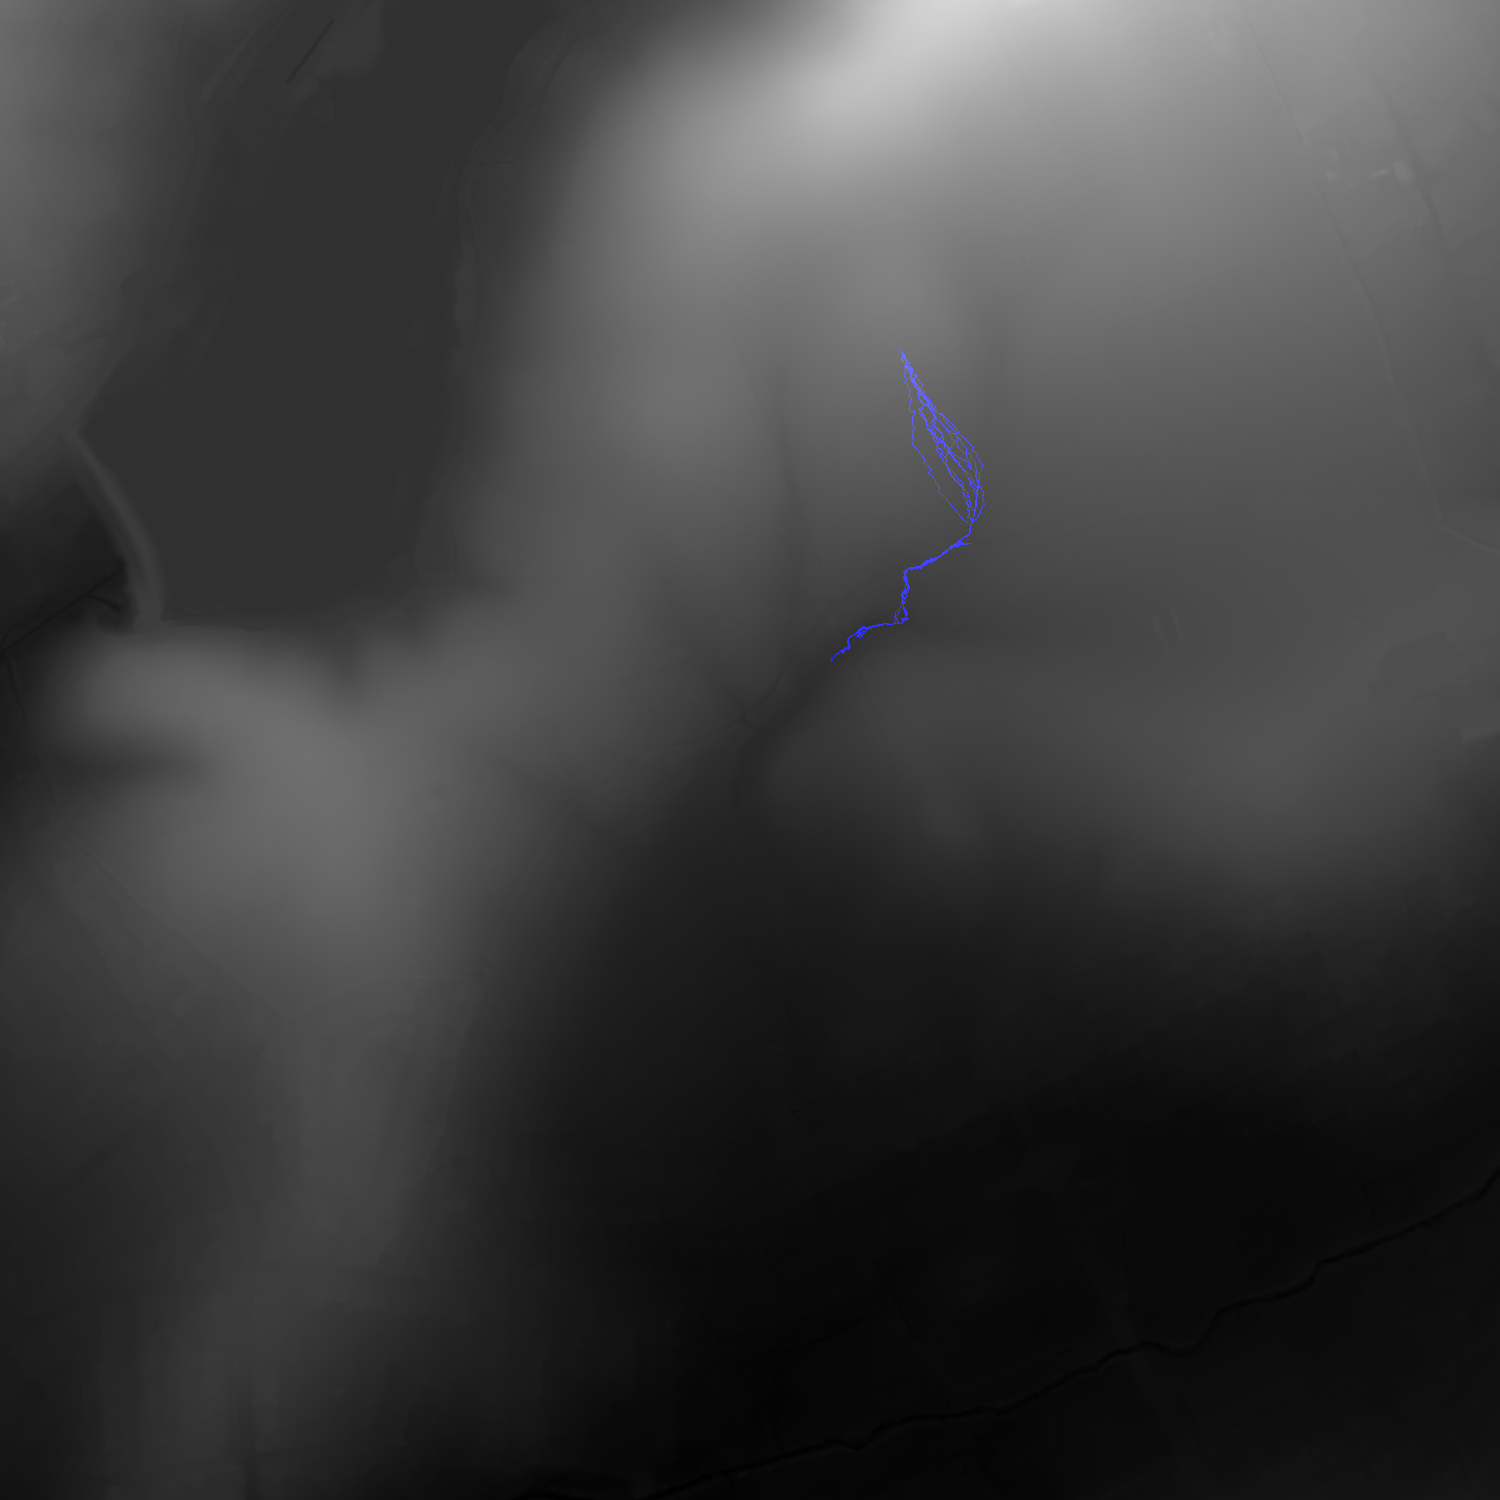
This section shows a number of modelled water flows through the SSSI. The method involves using gradient lines to follow a probable water flow from point to point, but applying Monte Carlo methods to give a more robust view that takes into account variations in the terrain.